Velocity-Time Graph Questions
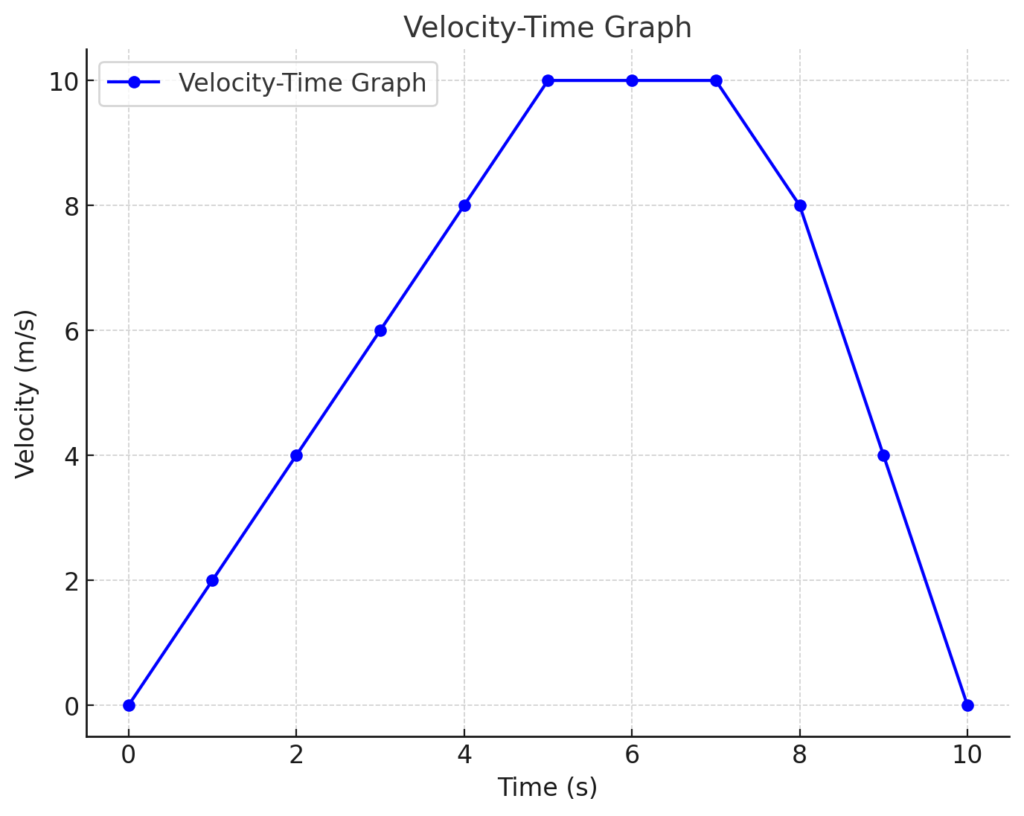
1. Sketch the velocity-time graph based on the description provided.
The graph should show:
- Acceleration from 0-5 seconds (0 to 10 m/s).
- Constant velocity from 5-8 seconds (10 m/s).
- Deceleration from 8-10 seconds (10 m/s to 0).
Coordinates for the graph:
| Time (s) | Velocity (m/s) |
|---|---|
| 0 | 0 |
| 1 | 2 |
| 2 | 4 |
| 3 | 6 |
| 4 | 8 |
| 5 | 10 |
| 6 | 10 |
| 7 | 10 |
| 8 | 8 |
| 9 | 4 |
| 10 | 0 |
Note: A visual sketch is required for this question.

2. What is the acceleration of the car during the first 5 seconds?
Acceleration is calculated using the formula:
a = Δv / Δt
For the first 5 seconds:
- Initial velocity (u) = 0 m/s
- Final velocity (v) = 10 m/s
- Time (t) = 5 seconds
Substituting values:
a = (10 – 0) / 5 = 2 m/s²
Answer: The acceleration is 2 m/s².
3. For how long does the car travel at a constant velocity?
From the graph, the car maintains a constant velocity of 10 m/s from 5 seconds to 8 seconds.
Answer: The car travels at a constant velocity for 3 seconds.
4. What is the deceleration of the car from 8 seconds to 10 seconds?
Deceleration is calculated using the formula:
a = Δv / Δt
For the deceleration phase:
- Initial velocity (u) = 10 m/s
- Final velocity (v) = 0 m/s
- Time (t) = 2 seconds (10 – 8)
Substituting values:
a = (0 – 10) / 2 = -5 m/s²
Answer: The deceleration is 5 m/s².
5. Calculate the total distance traveled by the car during the 10 seconds.
The total distance is the area under the velocity-time graph. The graph can be divided into three regions:
- Region 1 (0-5 s): Triangle area
Area = ½ × base × height = ½ × 5 × 10 = 25 m - Region 2 (5-8 s): Rectangle area
Area = base × height = 3 × 10 = 30 m - Region 3 (8-10 s): Triangle area
Area = ½ × base × height = ½ × 2 × 10 = 10 m
Total distance:
25 + 30 + 10 = 65 m
Answer: The total distance traveled is 65 m.


